Boys and Spelling

I rather like this new paper by Treiman et al (2019) in Scientific Studies of Reading on “The unique role of spelling in the prediction of later literacy performance” or in actual fact word reading performance because that is the only outcome measure in this study, albeit measured longitudinally between kindergarten and ninth grade and in 970 children. The upshot is that early spelling predicts unique variance in ongoing word reading skills after taking into account early phonological awareness, vocabulary and letter knowledge skills. Presumably spelling captures other important aspects of literacy knowledge such as orthographic knowledge and also I imagine morphological skills.

I have been interested in spelling for a while now because it is the aspect of literacy most likely to be impaired in children who have speech sound disorders. Furthermore, the Quebec government (that funded the research that I will describe here) had been concerned by falling literacy test scores across the province’s schools and the scores for orthography (a combination of spelling and morphology) had been particularly low. Specifically the percentage of children passing the province wide literacy test with respect to orthography fell from 87% in the year 2000 to 77% in 2005 whereas the proportion of children scoring in the unsatisfactory range increased from 5% to 11% over the same period.

Therefore, a group of us set out to develop a tool to predict spelling difficulties in French-speaking children in Quebec, the result being PHOPHLO (Prédiction des Habiletés Orthographiques Par des Habiletés Langage Oral). Specifically, we hypothesized that spelling difficulties at the end of the first and third grades could be predicted by examining oral language skills at the end of kindergarten/beginning of first grade using an ipad based screen of speech perception, speech production, rime awareness and morphology productions skills (more about the test at www.dialspeech.com). The test was found to accord well with teacher predictions of spelling difficulties and objective measures of spelling at the end of first grade:

Kolne, K., Gonnerman, L., Marquis, A., Royle, P., & Rvachew, S. (2016). Teacher predictions of children’s spelling ability: What are they based on and how good are they? Language and Literacy, 18(1), 71-98. [open access]

In a larger study we documented specificity and sensitivity of 93% and 71% respectively for the prediction of spelling at the end of second grade:

Rvachew, S., Royle, P., Gonnerman, L., Stanké, B., Marquis, A., & Herbay, A. (2017). Development of a Tool to Screen Risk of Literacy Delays in French-Speaking Children: PHOPHLO. Canadian Journal of Speech-Language Pathology and Audiology, 41(3), 321-340. [open access]

We are especially proud of this latter paper because it won the editor’s paper from CJSLPA. And I am especially proud of Alexandre Herbay because he created such beautiful software with only 6 months of funding from MITACS.

The reason for this blog is that it was only after publishing these papers that it occurred to me to look for gender effects in the data! I don’t know why because the province wide literacy test results had been flagging issues with gender differences in literacy performance all along. There has been a significant gap favouring the girls in literacy performance across all scoring criteria since 2000: even after improving the success rate considerably since 2005, the gender gap persists. For example, in 2010 88.7% of children passed orthography but the rate for girls was 90.1% versus the rate for boys at 81.3%. With this concern about the performance of boys looming large at the provincial level, it finally occurred to me to wonder if our PHOPHLO screener would be sensitive to gender differences.

The answer to my question is interesting on two accounts. First there turns out to be a big gender effect in spelling outcomes, as follows: girls who passed the PHOPHLO screener obtained a second grade spelling test score of 51 which compares to 40 for the girls who failed the PHOPHLO screener; boys who passed the PHOPHLO screener achieved a second grade spelling test score of 47 which compares to a spelling test score of 31 for boys who failed the PHOPHLO. This means that PHOPHLO predicted PHOPHLO performance for both boys and girls (main effect of PHOPHLO, F(1,74) = 26.71, p < .0001) but boys obtained lower scores than girls regardless of their PHOPHLO performance (main effect of gender, F(1,74) = 6.61, p = .012) with no significant interaction.

The second interesting finding however was that there was no gender difference in PHOPHLO scores: as measured by this screener the children had equivalent language skills at school entry. There are three possible explanations. The screener is only a screener and therefore it is quite likely that there are differences in language performance between the boys and girls at school entry that are uncovered by the PHOPHLO screener, given that boys and girls do have a different trajectory for early language development, although typically only for language production and it is often reported that they have caught up by school age. Another possibility is that these early language differences cause a difference in executive functions or temperament for boys that impacts their ability to learn literacy skills in school. The third possibility is that boys are treated differently in school due to gendered social expectations for behavior, interests and social identity that discourage literacy related activities for boys. In any case, this finding raises questions about what happens to boys at school between kindergarten and first grade. Our research is currently concerned with this question and I will share those results during my keynote address at the upcoming 2019 joint conference of Speech Pathology Australia and the New Zealand Speech Therapists Association in Brisbane.

How to score iPad SAILS

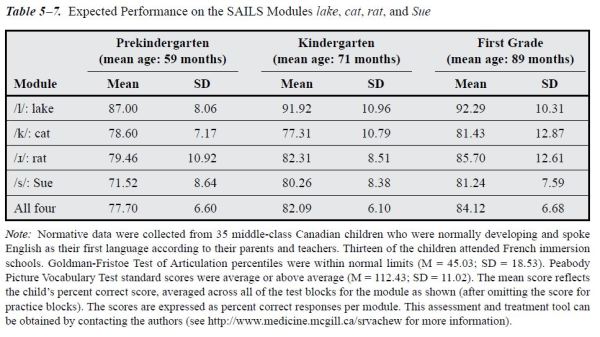
As the evidence accrues for the effectiveness of SAILS as a tool for assessing and treating children’s (in)ability to perceive certain phoneme contrasts (see blog post on the evidence here), the popularity of the new iPad SAILS app is growing. Now I am getting questions about how to score the new SAILS app on the iPad so I provide a brief tutorial here. The norms are not built into the app since most of the modules are not normed. However, four of the modules are associated with normative data and can be used to give a sense of whether children’s performance is within the expected range according to age/grade level. Those normative data have been published in our text “Developmental Phonological Disorders: Foundations of Clinical Practice” (derived from the sample described in Rvachew, 2007) but I reproduce the table here and show how to use it.

When you administer the modules lake, cat, rat and Sue you will be provided with an overall Level score for all the Levels in each module as well as item by item scores on the Results page. As an example, I show the results page below after administering the  rat module.

SAILS results screenshot rat

The screen shot shows the item-by-item performance on the right hand side for Level 2 of the rat module. On the left hand side we can see that the total score for Level 2 was 7/10 correct responses and the total score for Level 1 was 9/10 correct responses (we ignore responding to the Practice Level). To determine if the child’s perception of “r” is within normal limits, average performance across Levels 1 and 2: [(9+7)/20]*100 = 80% correct responses. This score can be compared to the normative data provided in Table 5-7 of the second edition of the DPD text, as reproduced below:

SAILS Norms RBL 2018

Specifically a z-score should be calculated: (80-85.70)/12.61 = -.45. In other words, if the child is in first grade, the z score is calculated by taking the obtained score of 80% minus the expected score of 85.70% and dividing the result by the standard deviation of 12.61 which gives a z score that is less than one standard deviation below the mean. Therefore, we are not concerned about this child’s perceptual abilities for the “r” sound. When calculating these scores, observe that some modules have one test level, some have two and some have three. Therefore the average score is sometimes based on 10 total responses, sometimes on 20 total responses as shown here, and sometimes on 30 total responses.

The child’s total score across the four modules lake, cat, rat and Sue can be averaged (ignoring all the practice levels) and compared against the means in the row labeled “all four”. Typically you want to know about the child’s performance on a particular phoneme however because generally children’s perceptual difficulties are linked to those phonemes that they misarticulate.

Normative data has not been obtained for any of the other modules. Typically however, a score of 7/10 or less than 7/10 is not a good score – a score this low suggests guessing or not much better than guessing given that this is a two alternative forced choice task.

Previously we have found that children’s performance on this test is useful for treatment planning in that children with these speech perception problems will achieve speech accuracy faster when the underlying speech perception problem is treated. Furthermore, poor overall speech perception performance  in children with speech delay is associated with slower development of phonological awareness and early reading skills.

I hope that you and your clients enjoy the SAILS task which can be found on the App Store, with new modules uploaded from time to time: https://itunes.apple.com/ca/app/sails/id1207583276?mt=8


Scatterplots and Speech Therapy

I have been looking for an opportunity to try out this neat spread sheet for creating scatterplots as an alternative to the standard bar graph as a way of presenting the results of a treatment trial. This week the American Journal of Speech-Language Pathology posted our manuscript “A randomized trial of twelve-week interventions for the treatment of developmental phonological disorder in francophone children”. In the paper we compare outcomes (speech production accuracy and phonological awareness) for the four experimental groups in comparison to a no-treatment group using the standard bar graphs. Weissberger et al disparage this presentation as “visual tables” that mask distributional information. They provide a spreadsheet that allows the researcher to represent data so that the underlying individual scores can be seen. I am going to show some of the speech accuracy data from the new paper that Françoise and I have just published in this form.

In our trial we treated 65 four-year-old francophone children. Each child received the same treatment components: 6 one hour individual therapy sessions targeting speech accuracy, delivered once per week in the first six weeks; followed by 6 one hour group therapy sessions targeting phonological awareness, delivered once per week in the second six weeks; simultaneously in the second six weeks, parents received a parent education program. The nature of the individual therapy and parent education programs was varied however with children randomly assigned to four possible combinations of intervention as follows: Group 1 (Output-oriented Individual Intervention and Articulation Practice Home Program); Group 2 (Output-oriented Individual Intervention and Dialogic Reading Home Program); Group 3 (Input-oriented Individual Intervention and Articulation Practice Home Program); Group 4 (Input-oriented Individual Intervention and Dialogic Reading Home Program). The Output Oriented Individual Intervention and the Articulation Practice Home Program components focused on speech production practice so this was a theoretically consistent combination. The Input Oriented Individual Intervention and the Dialogic Reading Home Program included procedures for providing high quality inputs that required the child to listen carefully to those inputs with no explicit focus on speech accuracy; the child might be required to make nonverbal responses or might choose to make verbal responses but adult feedback would be focused on the child’s meaning rather than on speech accuracy directly. This combination was also theoretically consistent. The remaining two combinations mix and match these components in a way that was not theoretically consistent. All four interventions were effective relative to the no-treatment control but the theoretically consistent combinations were the most effective. The results are shown in bar graphs in Figures 2 and 3 of the paper.

Here I will represent the results for the two theoretically consistent conditions in comparison to the no-treatment control condition, using the Weissberger Paired Data Scatterplot Template to represent the pre- to post-treatment changes in Percent Consonants Correct (PCC) scores on our Test Francophone de Phonologie. The first chart shows the data for the Input Output Oriented/Articulation Practice intervention (Group 1) compared to the no-treatment group (Group 0). You might be surprised by how high the scores are for some children pre-treatment; this is normal for French because expectations for consonant accuracy are higher in French than in English because consonants are mastered at an earlier age even although syllable structure errors persist and may not be mastered until first or second grade. The important observations are that the difference scores for the no-treatment group are tightly clustered around 0 whereas the difference scores in the treated group are spread out with the average (median) amount of change being 7 points higher than 0.

Group 0 v 1

Next I show the same comparison for the Output Input Oriented/Dialogic Reading intervention (Group 4) in comparison to Group 0. In this case the median of the difference scores is 9, slightly higher than for Group 1, possibly because the pretreatment scores are lower for this group. In any case, it is clear that a treatment effect is observed for both combinations of interventions which is striking because in one group the children practiced speech with direct feedback from the SLP and parent about their speech accuracy whereas in the other group direct speech practice and feedback about speech accuracy was minimal!

Group 0 v 4.

Do these scatterplots provide any additional information relative to the traditional bar charts that are shown in the AJSLP paper? One thing that is clearer in this representation is that there are children in Group 1 and in Group 4 who did not respond to the treatment. Randomized control trials tell us about the effectiveness of interventions on average. They can help me as a researcher suggest general principles (such as, given a short treatment interval, a theoretically consistent intervention is probably better than an “eclectic” one). As a speech-language pathologist however you must make the best choice of treatment approach for each individual child that walks into your treatment room. Providing an evidence base to support those decisions requires access to large research grants for very very large multi-site trials. There is only so much we can learn from small trials like this.

I hope that you will check out the actual paper however which includes as supplemental information our complete procedure manual with a description of all target selection and treatment procedures, equally applicable to English and French.